Cold chain equipment holdover calculator
About this page
This page was written by the New Horizons engineering team, which operated until December 2025. First-person references ("we", "our") are the original authors'. A number of those authors are now working with Phoenix GH, which maintains this material and stands behind it. Questions and comments are welcome — please get in touch.
ILR Thermal Battery Holdover
An ice-lined refrigerator (ILR) creates an ice bank when power is available, and relies on the ice bank to cool the vaccine storage compartment when power is unavailable. Here, "ILR" will be used as a generic term, also including solar-direct drive refrigerators and refrigerators with different types and shapes of ice banks. ILRs have different amounts of rated holdover; that is, the amount of time that the vaccine storage chamber of a powered vaccine refrigerator or storage device will remain between +2°C and +8°C after the power supply is disconnected.
Holdover Calculator
During PQS verification testing, holdover time is measured after several days of stable operation and sufficient power, at +43°C ambient temperature, and this value is reported in the PQS catalog. However, in real situations when cold-chain equipment (CCE) are installed at a health facility, staff are often unaware of the recent power availability profile at the facility or the ambient temperature, and are unable to estimate how much holdover time is actually available when a power outage begins.
Calculating and displaying the estimated real-time holdover of a refrigerator, based on actual conditions, empowers health workers and systems to plan ahead to more effectively manage and protect vaccines. A holdover calculator was implemented in a vaccine refrigerator in 2017, and a review of data from several hundred deployed units confirms that the calculated holdover is a reliable and conservative predictor of actual holdover in a wide range of ambient temperature and power conditions.
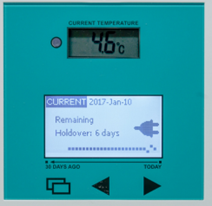
Examples of observed uses:
- A facility power outage begins on Thursday and power has not yet been restored by the time the nurse is preparing to go home on Friday afternoon. She sees that there are still 4 days of holdover remaining and knows that she does not have to activate her contingency plan that afternoon. The vaccines will still be cold when she returns Monday morning, and at that point if power has not returned, she can arrange to move the vaccines to another facility on Tuesday.
- There is an issue with the facility’s power – burnt sockets, generator needing fuel or service, etc. The holdover indicator shows how many days of safe cold storage remain while waiting for the repair or before the contingency plan is activated, giving logisticians more flexibility to plan technician schedules and allowing the facility to continue vaccinating for several additional days before moving the vaccines.
Overview
Holdover is a dynamic quantity that changes over time and varies with conditions. A diagram showing some of the ways that holdover can vary is shown below:
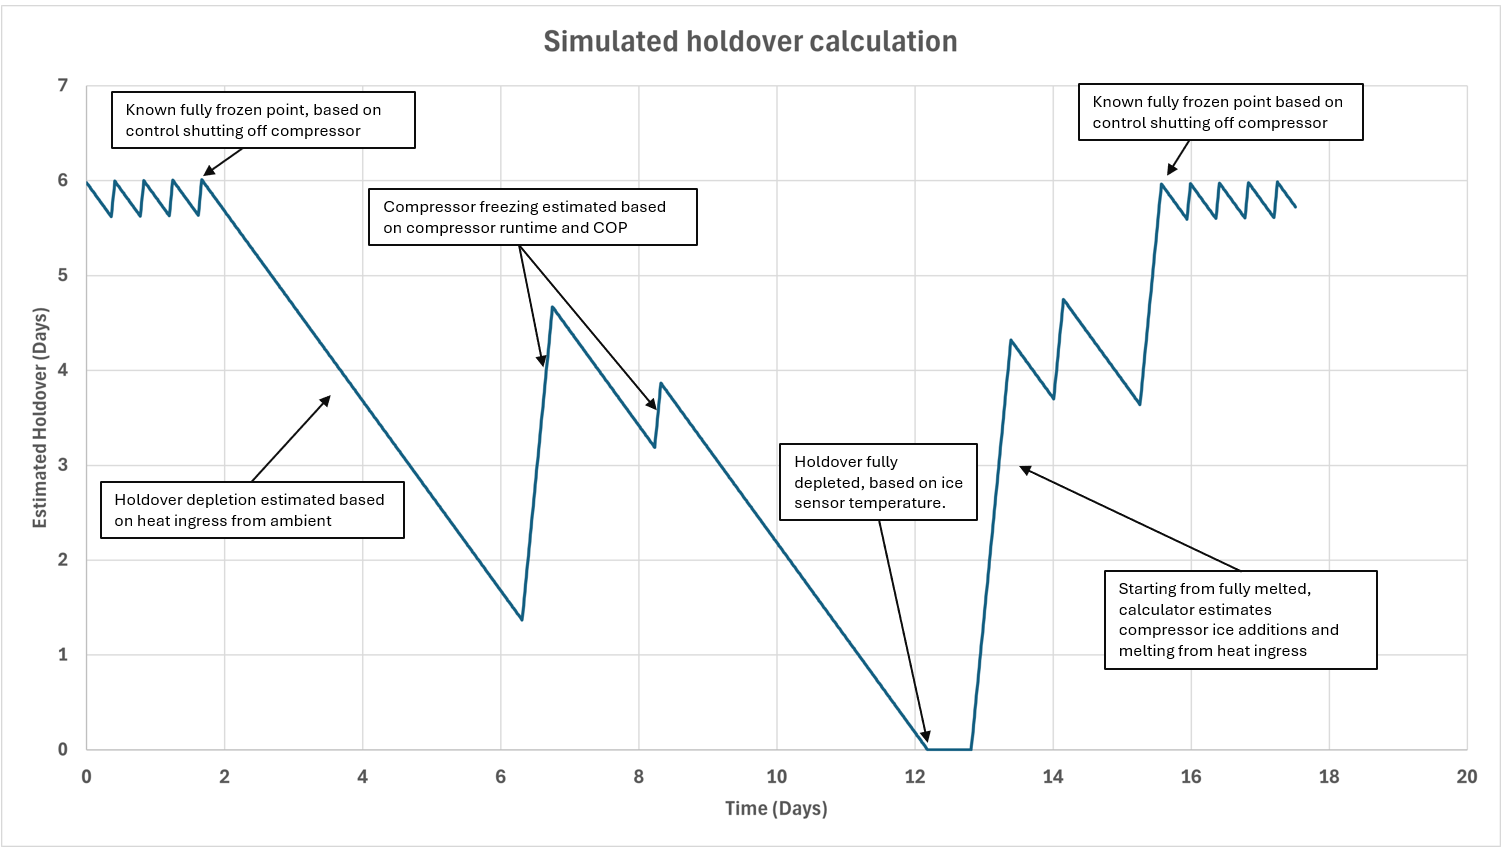
The above diagram shows how, during normal operation, the ice in the ice bank slowly melts and holdover decreases. When the compressor periodically activates to restore the ice to its fully frozen state, holdover increases. When power is lost, holdover falls as the ice melts - and ideally, the value for holdover decreases by one day for every day’s worth of lost power and becomes zero when all the ice has fully melted.
The diagram above also illustrates how a power failure during a compressor run affects holdover. This is a fairly likely scenario since power can go through periods where it is unreliable and only available in relatively short bursts.
The value calculated for holdover is dependent on the amount of water in the ice bank that is frozen at any given moment. This quantity of ice is always changing but cannot be directly measured, so the holdover algorithm must keep a running estimate of the amount of ice. This estimate must be decreased as the ice melts and increased as the compressor runs, etc. The purpose of this document is to present techniques for maintaining this running estimate and using it to calculate holdover.
Bear in mind that users of the refrigerator will depend on the displayed holdover value to help them keep their vaccines safe. Even so, the value calculated for holdover is just an estimate and therefore has some inherent error. Because of this, the value for holdover displayed to the user should be somewhat conservative so that the user can count on having at least the amount of time displayed to take an appropriate action in the event of a power failure, etc.
Basic Equation for Holdover Calculation
The basic equation for calculating holdover time during a power failure is:
That is, the amount of time it takes for the ice in the ice bank to completely melt (\({t}_{holdover}\) in seconds) is equal to the latent heat constant for ice (\({C}_{ice}\) = 334 kJ/kg) times the mass of remaining ice in the ice bank (\({M}_{ice}\) in kg or liters) divided by the refrigerator’s heat leak constant (\({C}_{leakage}\) in kJ/s/°C) times the temperature gradient across the refrigerator’s insulation (\({T}_{external} - {T}_{internal}\) in °C). \({T}_{internal}\) is generally the temperature of the ice bank which is almost always around 0°C. \({T}_{external}\) is the temperature outside of the refrigerator: the ambient temperature. \({C}_{leakage}\) is a constant that is dependent on the refrigerator’s insulation and overall configuration. Methods for measuring \({C}_{leakage}\) will be covered in later sections.
Note that the equation above is only for the simplest case; how holdover behaves when power is lost and no other factors (such as the compressor, heaters, vaccine chamber door, etc.) affect the outcome. The following sections will cover methods for incorporating these factors into the holdover calculations.
Note also that although the equation above calculates holdover in seconds, it is certainly not accurate to the second since it is based on estimated values like the quantity of ice remaining in the ice bank, and future ambient temperatures. It is probably better to display integer days and always rounds downward. For instance, if holdover is calculated as 3.6 days, it should not be displayed as 3.6 days because that would imply that the value is accurate to 1/10 of a day. It cannot be rounded upward and displayed as 4 days because this would imply that the user can depend on 4 full days of holdover.
Another case to consider is what happens to the above equation when the ambient temperature is very low. As the ambient temperature approaches the internal temperature of the refrigerator, the denominator in the equation above becomes zero. In that case, holdover becomes infinity. Although the ambient temperature will never actually get that low under normal operating conditions, it can get low enough where the calculated value for holdover becomes absurdly high. We recommend limiting the displayed value, for instance never showing a holdover value greater than 20 days. Values greater than about 20 days would be inaccurate at best.
Factors Affecting Holdover Calculation
Several factors affect the calculation of holdover to some extent. Some are negligible depending on design and some are key and need to be considered. A list of some factors to consider is shown below. More detail for some of these contributing factors will be discussed in later sections.
-
The quantity of ice remaining is the most important factor when determining holdover. Still, this quantity cannot be directly measured, but must be estimated by incrementally adding the effects of heat leakage, compressor action, heater effects, etc., starting from a point where the quantity of ice is known (for instance, when the ice is optimally frozen, or when it is completely melted).
-
The ambient temperature is the next most important factor when determining holdover. This quantity also cannot be directly measured since it is the future expected average temperature over the life of the remaining ice. Therefore, it must be estimated from past temperatures.
-
The heat leak factor is a measure of how quickly ice will melt at a given ambient temperature for a given refrigerator configuration. The heat leak factor is a constant and can be measured and verified using any of the methods described in Appendix A.
-
When the compressor runs, it adds ice to the ice bank and thus increases holdover. The amount of ice a given compressor adds can be estimated for a given refrigerator configuration from the ambient temperature and the power that the compressor draws.
-
Ice-lined refrigerators often implement a heater in the vaccine chamber to prevent the effects of the compressor from over-cooling the vaccines. The effect of this heater also decreases the available ice dependent on the power supplied to the heater and the amount of time it is active.
-
The quantity of water (frozen and liquid) in the ice bank is important. If the ice bank holds only half as much water as expected (due to improper filling or leakage), then even when “optimally frozen”, the ice in the ice bank will be much less than expected and so will the holdover.
-
Sensors, sensor placement and compressor run algorithm can determine the accuracy of the ice quantity estimation. This is especially true when estimating when the compressor should turn off due to the ice being “optimally frozen”. When the ice is considered to be “optimally frozen” is one of the few times when the quantity of remaining ice is “known”. Experimentation under different conditions (compressor run time, ambient temperature, etc.) will be helpful in determining whether the quantity of ice available when the compressor turns off will be consistent.
-
Accumulation of error can occur when the refrigerator must operate for an extended period without enough electrical power to completely freeze the ice. Since the only times the amount of ice is truly known are when the ice is fully melted or fully frozen, if neither of these states are attained for a long period of time, then small errors in the calculation of heat leak and compressor contribution, etc., add up to make the estimated ice quantity increasingly inaccurate. Therefore, it is important to test the implemented algorithm in real-world power conditions to ensure that the accumulated error under expected conditions is within acceptable limits.
-
Vaccine chamber door openings change the heat leak characteristics of the refrigerator while the door is open. The effect is greater for cabinet style refrigerators than for chest style. Normally, the effect of door openings is effectively negligible with respect to holdover but can become significant if the door is accidentally left open.
-
Sensors can fail over time, so it is important to plan what happens when they do. In some cases, (particularly if there are redundant sensors) the refrigerator can still provide useful service, or still be useful enough with a modified algorithm. If a sensor fails that is required for predicting holdover, it is important that holdover is not displayed rather than displaying a misleading value.
Measuring the Heat Leak Constant
Every refrigerator design will have its own heat leak constant. So that holdover for that refrigerator can be calculated, its own heat leak constant must be measured. Specific methods for measuring the heat leak constant are available in Appendix A.
For all these methods, it is necessary to be able to maintain a constant ambient temperature in the testing environment.
It is also a good idea to be certain of the value assigned to \({C}_{leakage}\) by checking it with multiple refrigerators of the same design to be assured that the quality of the refrigerator’s insulation is consistent.
Estimating the Remaining Ice in the Ice Bank
Note that in a classical thermodynamic sense, adding heat to a system will increase its energy. However, for a system designed around cooling, it can be useful and can simplify the math to think about “cooling energy”, that is, that the ice bank is analogous to a battery storing energy. Running the compressor adds to the stored cooling energy, while leakage through the fridge walls to the ambient around the refrigerator reduces energy stored in the thermal battery. Because of this, all references to “energy” below will mean “cooling energy”.
The most important quantity to know when calculating holdover is the amount of water in the ice bank that is frozen. Although it is the mass of the ice that determines how much holdover is available, it is more convenient to consider the quantity of ice in terms of the usable energy stored in the ice bank:
That is, the energy stored in the ice bank (in kJ) is equal to the mass of the remaining ice (in kg) multiplied by the latent heat constant for ice (334 kJ/kg). This product is more convenient because heat leak, heater loss, and compressor contribution are more simply expressed in terms of energy than in “mass of ice”.
Since the amount of ice remaining (the energy stored in the ice bank) cannot be directly measured, it must be estimated. This can be done by keeping a running estimate for \({E}_{ice\ bank}\) that is updated whenever the state of the ice is known (when the compressor algorithm determines that the ice is “optimally frozen” or when the ice is determined to be melted, etc.) and is periodically updated with the effects of loss due to heat leakage and any heater effects and updated with gains due to the compressor while it runs.
This means that the estimated energy contained in the ice bank is periodically updated (likely at the sensor sampling interval) as demonstrated by the equation below:
That is, the updated energy of the ice bank is equal to the previous energy of the ice bank plus the energy (if any) contributed by the compressor, minus the energy lost through heat leakage, minus the energy lost (if any) by the vaccine chamber heater.
Estimating Energy Lost Due To Heat Leakage
Heat leakage is always present during normal operation of a refrigerator. Therefore, the energy due to heat leakage must be continually subtracted from the running ice bank energy estimate at regular intervals. This energy can be calculated as:
That is, the energy lost due to heat leakage (in kJ) over a given interval of time (\({t}_{leakage}\) in seconds) is equal to the heat leak constant (in kJ/s/°C) multiplied by the difference in temperature between ambient (\({T}_{external}\)) and the ice (\({T}_{internal}\)) multiplied by the time interval (in seconds).
Estimating the Energy Lost Due To A Heater
A heater is often used in the vaccine chamber to maintain a safe temperature in cases where the low temperature of the ice could over-cool the vaccines. The energy that a heater removes from the ice can be expressed as:
That is, the energy removed from the ice (in kJ) is equal to the power drawn by the heater (\({P}_{heater}\) in kW) multiplied by the amount of time (in seconds) that the heater was drawing that power. Note that \({P}_{heater}\) is expressed in kW rather than Watts, so it will be a small number.
Estimating Energy Lost Due To An Open Door
Most of the time, the energy lost due to the door being open is negligible; particularly for a chest-style fridge where the vaccine chamber is completely beneath its door. It becomes a potentially greater problem for cabinet-style fridges where the door exposes the side of the vaccine chamber. In this case, the cold air within the vaccine chamber is quickly replaced by warmer air as the door is held open. This can leave the temperature of the vaccine chamber elevated for several minutes after the door has been closed. Restoring the temperature of the vaccine chamber costs added energy in the form of ice from the ice bank.
For a cabinet-style refrigerator, normal door openings can subtract a few hours from holdover depending on ambient temperature, humidity, how wide the door was opened, and for how long. On one occasion we tested, 6 door openings totaling 4 minutes decreased holdover by nearly 5 hours. On another occasion on the same fridge, 12 door openings totaling 9 minutes decreased holdover by only half that much. On still another occasion with the same fridge, the operator had not noticed that the door had been left slightly ajar until 18 hours later. This incident decreased holdover by more than three days.
What this illustrates is that door openings can be significant. It also shows that just knowing how many times a door was opened and for how long is not sufficient to predict how much holdover time is lost. This is especially true for the case above where the door was left ajar for 18 hours because during that time, the door switch indicated that the door was closed. This is because mechanical door switches are generally not precise enough to determine the difference between “mostly closed” and “closed with a good seal”.
A method that we have found helpful for measuring the effects of door openings on holdover is to monitor the vaccine chamber temperature. If the vaccine chamber temperature becomes significantly greater than expected while the ice bank is still cold, it is likely due to a door opening. When the door is open and the temperature of the vaccine chamber is elevated, it will generally remain elevated long after the door has been closed since it takes time for the ice to restore equilibrium. So, measuring how high the vaccine temperature becomes and how long it is elevated can provide a good estimate for how a given door opening will affect holdover. This is shown by the equation below:
That is, the energy due to a door opening (\({E}_{door}\) in kJ) is equal to the door open constant (\({C}_{door}\) in kJ/s/°C) multiplied by the vaccine chamber temperature (\({T}_{vaccine}\) in °C) multiplied by the time that the vaccine chamber temperature was seen as elevated (\({t}_{door}\) in seconds).
This door open constant (\({C}_{door}\)) can be measured once the heat leak constant for the refrigerator with the door closed (\({C}_{leakage}\)) is determined. The fridge can be set up with the optimal amount of ice in the ice bank in an environment where the ambient temperature is high (around +43°C). The compressor and heater are then shut off and the vaccine chamber door is left open by some small amount. The refrigerator is left in that state until the ice is melted while the vaccine chamber temperature is monitored. The vaccine chamber temperature should rise when the door is opened and level off at some temperature where it remains for the bulk of the test. A good estimate for the door open heat leak could be determined as shown below:
That is, the door open leakage constant (in kJ/s/°C) is equal to the energy stored in the ice bank (\({E}_{ice}\) in kJ) divided by the time it took that ice to completely melt (\({t}_{melt}\) in seconds) minus the fridge’s heat leak constant (\({C}_{leakage}\) in kJ/s/°C) times the ambient temperature (\({T}_{ambient}\) in °C) all divided by the average temperature of the vaccine chamber during the test (\({T}_{vaccine}\) in °C).
This test should probably be repeated at a lower ambient temperature to validate that \({C}_{door}\) has a fairly consistent value. If it does, then the door open energy can be calculated as shown above and subtracted from the ice energy when it is determined that the vaccine chamber temperature is elevated enough to indicate that the door is open.
Most door openings affect holdover by an amount that is small enough to be comparable with the accuracy of the holdover calculation itself. That is, the energy lost due to a single door opening will usually be less than the difference between calculated holdover and the actual holdover. Still, in the case where door openings become numerous enough or long enough, calculated holdover will be more accurate if included rather than omitted.
Estimating Energy Added by a Compressor Run
The energy that a compressor run adds to the ice bank can be expressed as follows:
That is, the energy added to the ice block by the compressor (\({E}_{compressor}\) expressed in kJ) is equal to the power drawn by the compressor (\({P}_{compressor}\) expressed in kW), multiplied by the performance of the compressor at the current ambient temperature (\(COP({T}_{ambient})\) in kW/kW) multiplied by the time that the compressor ran (\({t}_{compressor}\) in seconds). Note that \(COP\) is not a constant, but a function whose value is different for different ambient temperatures.
As the compressor runs, the power that it draws will vary. Therefore, it is helpful to take measurements at a set interval of the power drawn by the compressor and the ambient temperature. The total energy for that interval is then calculated and added to the ice bank’s energy in real time.
In cases where it is impractical to measure the power drawn by the compressor, it may be sufficient in the case of constant-speed compressors to estimate the compressor contribution to the ice block as a function of only the ambient temperature and compressor run time:
Where \(P_{ice\ rate}(T_{ambient})\) is a function that estimates the rate that ice is added to the ice bank at the current ambient temperature (in kJ/s or kW), and \({t}_{compressor}\) is the time that the compressor ran at that temperature.
Note that \(COP\) and \({P}_{ice\ rate}\) are highly dependent on refrigerator configuration and must be determined by experimentation. Once determined, \(COP\) or \({P}_{ice\ rate}\) must be tested under different conditions to ensure that knowing only the ambient temperature is sufficient to produce a repeatable quantity of ice for the given refrigerator configuration. For instance, a compressor with an evaporator that is loosely coupled to the ice bank (whose temperature varies with respect to the relatively constant ice temperature) may need to include the evaporator temperature when determining \(COP\) or \({P}_{ice\ rate}\). A refrigerator configuration that uses a variable-speed compressor may need to include the speed of the compressor in the calculation of \(COP\) or \({P}_{ice\ rate}\).
Methods for determining compressor power to ice energy relationship
To empirically determine the relationship between ambient temperature and compressor \(COP\) for a given cabinet, we recommend running a set of tests where the ice bank is initially fully melted and the compressor is run continuously at a constant ambient temperature until the ice bank is fully frozen. Based on the compressor energy required to charge the full ice bank (removing all latent heat) and overcome the ambient heat leak and any heater input, a compressor \(COP\) can be calculated for a given ambient temperature. In equation form:
That is, the coefficient of performance for the compressor at a given ambient temperature (\({COP}_{ambient}\) in kW/kW) is equal to the sum of energy put into the ice, plus the energy lost due to heat leakage, plus the energy needed to compensate for the heater (all in kJ) divided by the power that the compressor drew (\({P}_{compressor}\) in kW) multiplied by the time that the compressor ran (\({t}_{compressor}\) in seconds).
Since both \(COP\) and power consumption for a constant-speed compressor are generally determined by the ambient temperature, the same test may also be used to determine \({P}_{ice\ rate}\), the power applied to the ice block while the compressor is running at a given ambient temperature. \({P}_{ice\ rate}\) for a given ambient temperature can be calculated as shown below:
That is, the power imparted to the ice at a given ambient temperature (\({P}_{ice\ rate\ ambient}\) in kW) is equal to the sum of energy put into the ice, plus the energy lost due to heat leakage, plus the energy needed to compensate for the heater (all in kJ) divided by the time that the compressor ran (\({t}_{compressor}\) in seconds).
Note that both \(COP\) and \({P}_{ice\ rate}\) are not constants, but equations that produce values that are dependent on the ambient temperature. Generally, a simple linear relationship exists between \({T}_{ambient}\) and \({COP}_{ambient}\) or \({P}_{ice\ rate\ ambient}\). So, running this test at 4 to 5 different ambient temperatures (e.g. +20°C, +25°C, +30°C, +35°C, and +43°C) and using linear regression on the results will produce a linear equation that should work well.
Although this is sufficient for constant-speed compressors, it works less well for variable speed compressors which may run at different speeds depending on available power. Such compressors are common for solar-powered refrigerators where the power available to run the compressor varies with available sunlight. For this type of compressor, \(COP\) or \({P}_{ice\ rate}\) are functions of both the temperature and the compressor speed (i.e., \(COP(T_{ambient}, S_{compressor})\) and \(P_{ice\ rate}(T_{ambient}, S_{compressor})\)). Because of that, you will not only want to run the above test at 4 or 5 ambient temperatures, but also at 4 or 5 different compressor speeds for each ambient temperature. Since \(COP(T_{ambient}, S_{compressor})\) and \(P_{ice\ rate}(T_{ambient}, S_{compressor})\) are dependent on both the ambient temperature and compressor RPM, multiple linear regressions will be needed to determine a workable equation.
Inferring ice states
Although it is not possible to directly measure the total amount of ice in the ice bank at any given moment, the amount of ice can be inferred when the water in the ice bank has reached some detectable states:
- The water in the ice bank is optimally frozen.
- The water in the ice bank is completely melted.
- The water in the ice bank has just begun to freeze.
Being able to detect these states (or more states if possible) is important because the energy in the ice bank can only be updated if it starts in some known state. Also, the energy estimates are only estimates and contain some inherent error. Therefore, the longer the ice is not in one of these detectable states, the farther the estimate can deviate from actual.
Detecting an optimally frozen ice bank
Generally, a temperature sensor or collection of sensors and some algorithm inform the compressor when to run and when to turn off. At some point, the compressor is turned off due to the ice bank being in its optimal state - that is, a state such that it contains the most ice that it can hold without adversely affecting the vaccine chamber. At this point, the compressor algorithm can inform the holdover algorithm that the energy stored in the ice bank is known.
The algorithm used to detect the optimal ice state may not be simple due to the following factors:
-
Compressor run time affects the final state of the ice since the longer the compressor runs, the larger the temperature gradient across the ice may become. When the compressor stops running, the temperature of the ice equalizes and the final state at equalization may be different than expected.
-
Ambient temperature affects the final state of the ice since it can exacerbate the temperature gradient or its effects.
-
Small differences in sensors can affect the final state of the ice since algorithms that work for one sensor or set of sensors might not work as well for another. For instance, the temperature gradient across the ice is small enough that a sensor’s precision becomes significant. Also, the difference between water and ice is a fraction of a degree.
Detecting a completely melted ice bank
This is perhaps the simplest thing to determine. If the temperature of the water in the ice bank is sufficiently above 0°C, then the ice is completely melted. Note that there will be some temperature gradient across the water, so parts of the water could still be perhaps half a degree above freezing while parts of the ice bank are still frozen. In our algorithms, we do not declare that the ice is melted until the water is above 2.5°C.
This is the point at which \({E}_{ice\ bank}\) is set to zero if it was not already equal to zero.
Detecting when the ice bank has begun to freeze
It is important to only count compressor energy toward holdover (\(E_{compressor} > 0\)) while it is adding ice to the ice bank. While the temperature of the ice bank is above the freezing point of water (0°C), the action of the compressor is contributing nothing to \({E}_{ice}\) since it is only removing the sensible heat of the ice bank’s water.
Only once the temperature of the water in the ice bank has reached 0°C is the energy of the compressor actually adding ice to the ice bank.
Alternatively, if the only temperature sensor available is not tightly coupled with the water in the ice bank, the start of ice formation can be detected by noting when the temperature of the water levels off. Care must be taken when using this method since the temperature of water also begins to level off briefly around +4°C as heat is removed from the water.
Estimating the Average Future Ambient Temperature
Calculating how ice in the ice bank will melt over the next few days requires estimating what the ambient temperature will be like over the next few days. The method that has worked well for us is to average the temperature over the past 7 days and assume that the temperature will be similar over the next few days. The disadvantage of this method is that future temperatures may be hotter than expected. To deal with that, the displayed holdover value should be a bit more conservative than the calculated estimate to account for any possible temperature increase. We purposely use a slightly inflated value for \({C}_{leakage}\) and a slightly low value for \(COP\). This causes the algorithm to calculate and display a holdover value that is about 20% below what one would otherwise expect.
When estimating future temperatures, it is helpful to realize that the temperature will rise and fall over the course of 24 hours. The temperature during the day will often be several degrees greater than the temperature during the night. This is why temperatures averaged over full days works better than using an instantaneous temperature or even a temperature averaged over just a few hours.
Appendix A: Measuring the Heat Leak Constant
One could determine the heat leak constant for a given refrigerator by putting it in a +43°C controlled environment, turning on the compressor until the ice in the ice bank is optimal and then shutting off its power and seeing how long the fridge keeps its vaccine chamber cold. However, the methods outlined below take much less time.
Reverse Equilibrium Method:
This method is by far the most common.
To speed the test, the refrigerator should have all water drained from the ice bank. The refrigerator is placed in a temperature-controlled environment that is held at some low external temperature (\({T}_{external}\)) such as +5°C. Heaters are then placed in the ice bank and vaccine chamber that heat both chambers to the same temperature (\({T}_{internal}\)) which is higher than ambient. This places a relatively high thermal gradient across the refrigerator’s insulation.
The power to the heaters (\({P}_{ice\ bank}\) and \({P}_{chamber}\)) is monitored. As the temperature in the ice bank and vaccine chamber approach the set temperature, the power drawn by the heaters will decrease and then level off when both chambers are at the set temperature (\({T}_{internal}\)). The power that these heaters draw at this point will determine the heat leak factor via this equation:
Where power is in kW, temperature is in °C and the heat leak factor is in kJ/s/°C.
Depending on the design of the refrigerator, it may not be necessary to have a heater placed in the ice chamber. This would be true if the difference in temperature between the ice bank and vaccine chamber is negligible without the second heater.
The Cold Water Method
This method may be slightly less accurate than the Reverse Equilibrium method but can be done at room ambient temperature (as long as that temperature is maintained throughout the test) and does not require special equipment.
To determine the heat leak constant using this method, the ice bank needs to be completely melted and contain a known quantity of water. There must also be a method to measure the temperatures of the water and the ambient.
-
Make sure that the ice bank contains a known amount of water (\({M}_{water}\)) and no ice. Run the test with the ice bank and cold chamber closed.
-
Run the compressor until the water in the ice bank is significantly colder than ambient, but not freezing.
-
Turn off the compressor. There are likely temperature gradients in the water, so wait a little bit for the temperature of the water to equalize. The sensed temperature may rise quickly at first if the sensor is near the coldest location in the water, and then settle into a much slower rise as heat leaks from the whole refrigerator.
-
Start the test by taking note of the initial temperature of the water (\({T}_{initial}\)) and the time (\({t}_{initial}\)) just after the gradients have settled.
-
When the temperature of the water has warmed roughly 75% of the way to ambient (\(0.75 \cdot ({T}_{ambient} - {T}_{initial}) + {T}_{initial}\)), note the temperature of the water (\({T}_{final}\)) and the time (\({t}_{final}\)).
Where \({T}_{ambient}\) is the ambient temperature, \({M}_{water}\) is the mass of the water in the ice bank (in kg or liters), \(ln()\) is the natural log function and \((t_{final} - t_{initial})\) is the time in seconds that it took to increase the temperature of the water by \((T_{final} - T_{initial})\) °C. \({T}_{ambient}\) is the average ambient temperature during the test. The heat leak constant (\({C}_{leakage}\)) will be in units of kJ/s/°C. This equation makes use of the constant for the specific heat of water: 4.184 kJ/kg/°C.
If you take periodic temperature measurements throughout this test, you can double-check your value for \({C}_{leakage}\) by verifying that the temperature of the water (\({T}_{test}\)) and the time that temperature was taken (\({t}_{test}\)) substituted for \({T}_{final}\) and \({t}_{final}\) in the equation above give consistent values for \({C}_{leakage}\). Or, you can verify that the value you determined for \({C}_{leakage}\) in the equation above will fairly accurately predict the temperature of the water in the equation below:
Where \(exp()\) is the exponential function or \(e\) to the power of the value in parenthesis.
Other methods:
Other experimental methods to determine heat leak include:
- Using additional sensors, visual confirmation of ice state, or direct measurement (such a draining and measuring any unfrozen water) as needed, conduct equilibrated holdover tests at multiple ambient temperatures (at least 2: high and low). End the test when the amount of ice remaining can again be accurately measured. Disregard data collected after the ice is completely melted.
- With the appliance equilibrated at a high ambient temperature, introduce a large amount of cold water (ideally filling at least a third of the volume of the vaccine chamber in as few containers of water as possible). Each water container (ideally just 1-2) should have multiple temperature sensors measuring water temperature. After an initial phase the water temperature should rise in an exponential curve and the slope at any given temperature gradient can be used to calculate heat leak.
Downloads
This code is an example of the above holdover calculator implemented in Python. It is provided under the permissive MIT License.
Contributors and contacts
Contributors: Bob Lockhart, Jenny Hu, Brian Pal Contact: Bob Lockhart
For more information, contact us about the holdover calculator.